Recently, I was reading through Christie Bahlai’s excellent roundup of spreadsheet best practices when I started thinking about documenting spreadsheets. You see, best practices say that spreadsheets should contain only one large data table with short variable names at the top of each column, which doesn’t leave room to describe the formatting and meaning of the spreadsheet’s contents. This information is important, especially if you are trying to use #otherpeoplesdata, but it honestly doesn’t belong in the spreadsheet.
So how do you give context to a spreadsheet’s contents? The answer is a data dictionary. And seeing as I haven’t found a good post on data dictionaries and data dictionaries are right up there with README.txt’s as a Documentation Structure of AwesomenessTM, I obviously need to give them a whole post on this blog.
So what is a data dictionary? A data dictionary is something that describes the data in a dataset. Generally, a data dictionary includes an overall description of the data along with more detailed descriptions of each variable, such as:
- Variable name
- Variable meaning
- Variable units
- Variable format
- Variable coding values and meanings
- Known issues with the data (systematic errors, missing values, etc.)
- Relationship to other variables
- Null value indicator
- Anything else someone needs to know to better understand the data
This list represents the types of things you would want to know when faced with an unknown dataset. Not only is such information incredibly useful if you’re sharing a dataset, but it’s also useful if you plan to reuse a dataset in the future or you are working with a very large dataset. Basically, if there’s a chance you won’t remember the details or never knew them in the first place, a data dictionary is needed.

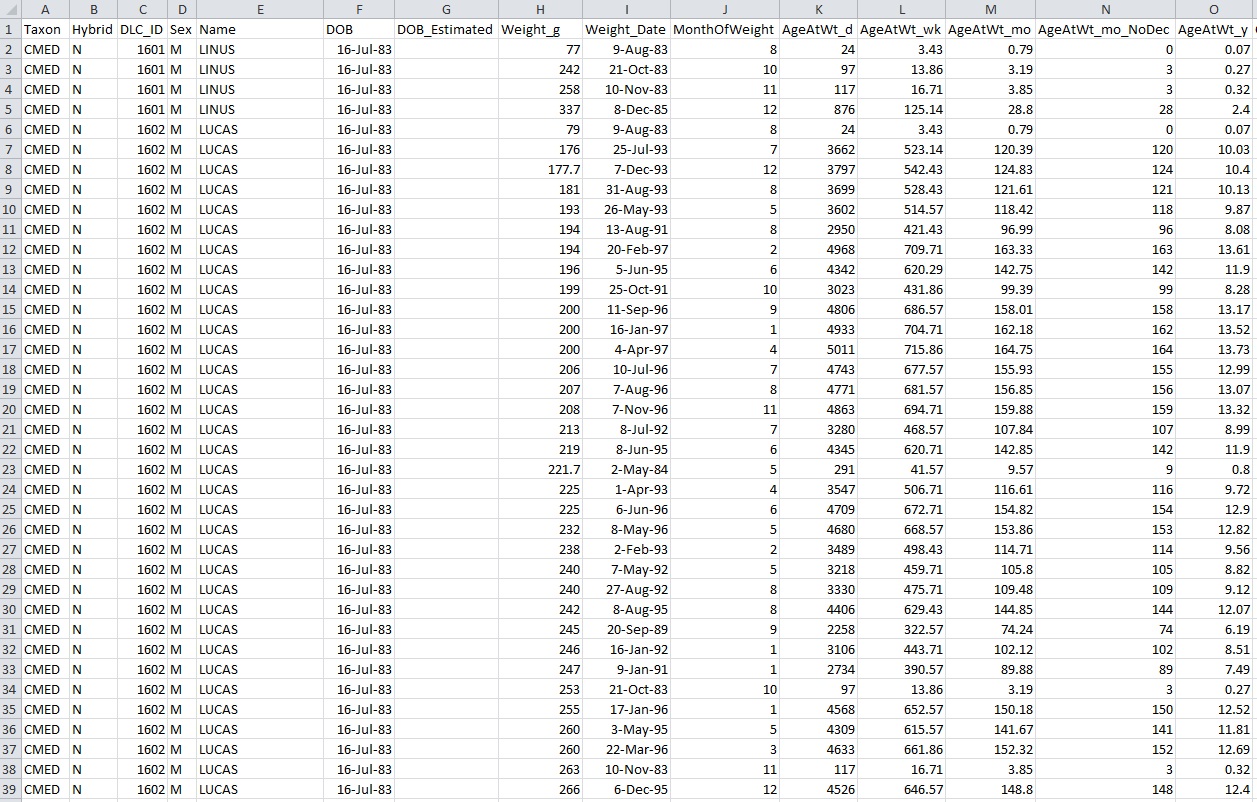
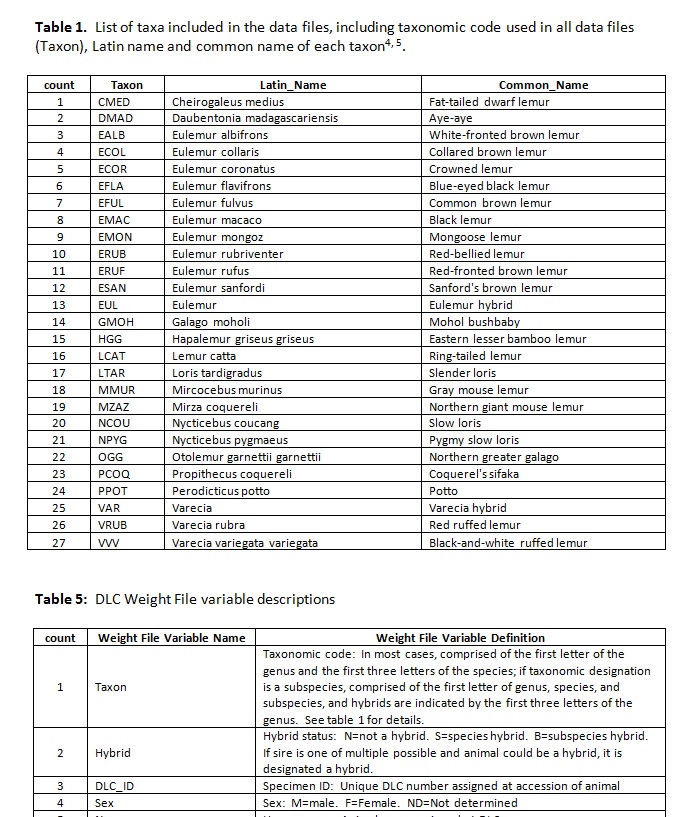
Let’s look at a real world example from some newly released data from the Duke Lemur Center (data descriptor, dataset). I downloaded the “DataRecord_3_DLC_Weight_File_06Jun14.csv” file from Dryad and found that, while the dataset is very clean (yay!), I can’t interpret all of the data from the spreadsheet alone. For example, what does the variable “AgeAtWt_mo_NoDec” mean or what does the “Taxon” variable code “CMED” stand for? Enter the data dictionary in the form of the README.doc file.

The Lemur data dictionary nicely lays out information on each variable in the dataset. For example, it defines the variable “AgeAtWt_mo_NoDec” as
Age in months with no decimal: AgeAtWt_mo value rounded down to a whole number for use in computing average individual weights (FLOOR(AgeAtWt_mo))
It also has a whole separate table listing the various Taxon codes. This is just the type of added context that describes the variables enough to make the data useful. It’s also the type of information that you can’t smoosh into a spreadsheet without ruining the spreadsheet’s order and computability. So this data dictionary is adding a lot of value and context to the data without messing up the data themselves.
The Lemur dataset can be easily understood and reused because it has clean data, well-named variables, and a nice data dictionary. If you are sharing your data publically, or even just with your future self, plan to give your data the same treatment. And if you don’t have time to do all three preparations? Make the data dictionary. You can’t use data you don’t understand.
Now go out and make some data dictionaries!


Pingback: On Documentation » Data Ab Initio
Pingback: Using Data Dictionary Creation as the Teaching Moment
Pingback: Open Data’s Dirty Little Secret » Data Ab Initio
Pingback: Cranfield University Blogs | Data documentation – what and why - Cranfield University Blogs
Pingback: Spreadsheet Best Practices » Data Ab Initio
Pingback: Love Your Data Week Feb 13th – 17th 2017 | Scholarly Communication Lab at Dartmouth
Pingback: Cranfield University Blogs | Data documentation – what and why
Pingback: Data Management for Data Doubles – Data Doubles